F5 BIG-IQ – Real-Time Application Visibility
There are lots of companies that don’t know why their applications are working slowly. Applications usually work well but when they get slow, lots of companies don’t know where they can look at. However, there are lots of tools really useful which can help us to monitor applications as well as the network. It’s really easy to install a network monitoring tool where we can import and add switches and servers to know bandwidth consumption, throughput, packets transmitted and received, etc. This kind of tools should be mandatory in most companies for monitoring services.
I’ve already written about F5 BIG-IQ and I told you where installing these devices are recommended. Most of all it’s recommended where there are lots of BIG-IP devices with lots of virtual servers, pools and nodes. However, I would also like to highlight an interesting feature for monitoring application services which is really useful for real-time application and network visibility. F5 BIG-IQ help us to know what’s happening thanks to Application Visibility and Analysis in Real Time feature.
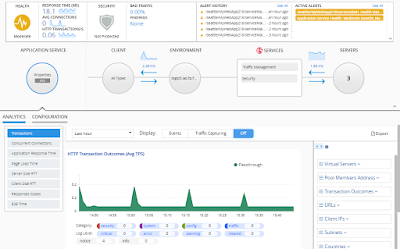
First of all, F5 BIG-IQ can monitor HTTP Application Services. In fact, it can monitor all of the HTTP virtual servers which pass through the BIG-IP devices. Therefore, it’s easy to get Application Response Time, Request Errors, which are the response code 4XX, Server Errors, which are the response code 5XX, Transactions Per Seconds (TPS), Incomplete Transactions, etc. All of them are needed to know how applications are going on. All of them are needed to have application visibility. However, there are many other interesting metrics such as E2E Time, Page Load Time, etc. Lots of companies would like to have this kind of metrics when their web applications are getting slow.
 |
| Monitoring HTTP traffic data |
F5 BIG-IQ can also monitor TCP Application Services. There are lots of useful metrics for troubleshooting. In addition, these metrics can be used along with HTTP Application metrics to improve the troubleshooting process. For instance, we can know the Server Side RTT (in ms) and the Client Side RTT (in ms). We can also know the Throughput (in Mbps) and the Goodput (in Mpbs). This last metric is important because Goodput is the rate at which useful data traverse a link. Therefore, assuming an uncongested path between endpoints, goodput and throughput will be as close as they are theoretically able to be. However, there are many other interesting TCP metrics such as Packets Lost, Connections or Delay States (3WHS, RWND, CWND, etc).
 |
| Monitoring TCP statistics |
Finally, F5 BIG-IQ can also notify us about Web Exploits and L7 DDoS Attacks. However, WAF should be deployed in BIG-IP devices to get Security Alerts. For instance, we can see Bad Traffic Trends which will be useful to investigate transactions and fine tune the security policy for new threats. We can also see Potentially Harmful Attacks which will be used to change the security policy to blocking mode. Of course, we will be able to see the Blocked Attacks to know the security policy is working properly.
Do you have a Real Time Application Visibility? How do you get these metrics? Have a nice day!


Commentaires
Enregistrer un commentaire